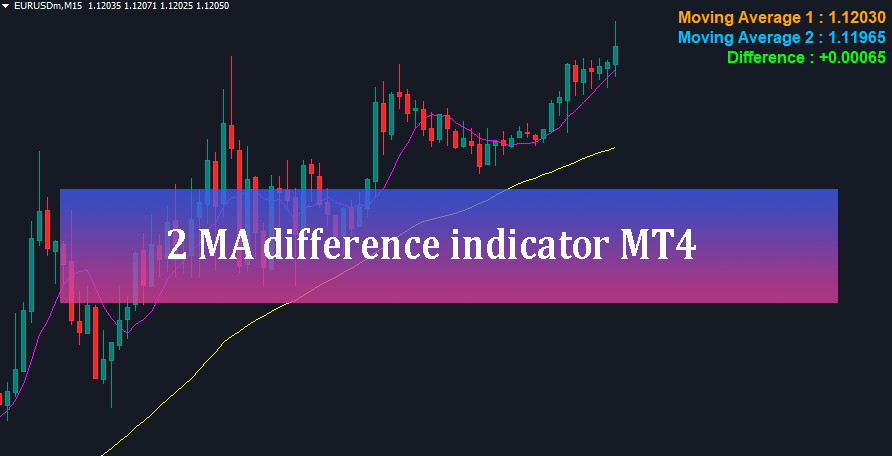
2 MA difference indicator MT4 is a simple yet powerful utility tool designed to plot two custom moving averages on your chart while calculating and displaying the exact numerical distance between them in real time.
Moving averages are among the most widely used technical indicators in financial trading. They smooth out price fluctuations to reveal trend direction, dynamic support, and resistance. However, analyzing moving averages visually can sometimes be misleading—especially when determining how quickly two MAs are converging or diverging. Measuring the exact spread between a fast MA and a slow MA provides valuable insight into market momentum, potential crossovers, and overbought/oversold conditions. The 2 MA difference indicator MT4 automates this process by displaying the price values of two distinct moving averages along with their live difference directly on the trading screen.
What is the 2 MA Difference Indicator MT4?
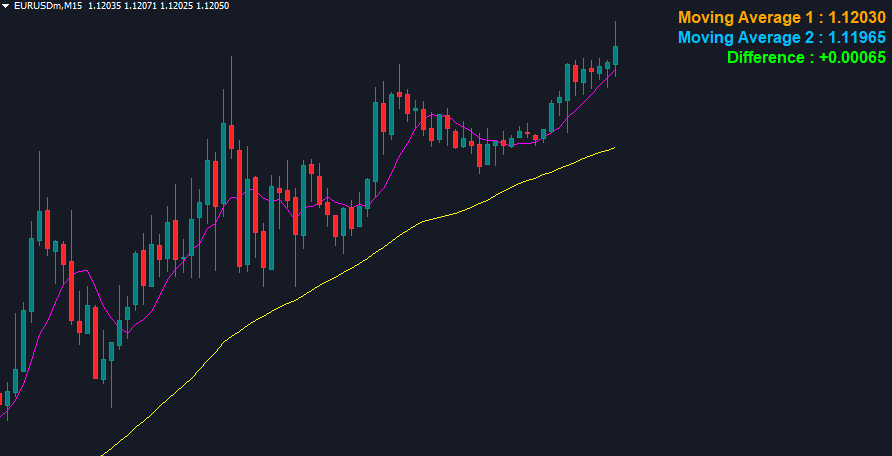
The 2 MA difference indicator MT4 overlays two fully configurable moving averages onto the main price window and calculates the spread (difference) between their current values. The result is conveniently rendered as an on-screen text box in the upper right corner of your chart, showing the exact price level of Moving Average 1, Moving Average 2, and the resulting positive or negative difference. This numerical feedback allows traders to quantify momentum changes instantly without manually hovering over lines or relying on secondary oscillator windows.
Key Features of 2 MA Difference Indicator MT4
1. Dual Moving Average Plotting: Renders two independent moving averages directly on your price action chart.
2. Real-Time Spread Calculation: Computes the live numerical difference between MA1 and MA2 on every price tick.
3. Dynamic Color Feedback: Features color-coded text that highlights whether the difference is positive, negative, or neutral for rapid visual confirmation.
4. Complete Calculation Customization: Full control over periods, averaging methods (Simple, Exponential, Smoothed, Linear Weighted), and applied prices for both MAs
5. On-Screen Display Offset Controls: Easily adjust font sizes and screen coordinates ($X$ and $Y$ offsets) to prevent overlapping with other custom indicators.
Understanding Indicator Settings and Inputs
The input parameter tab provides extensive options to tailor both the calculations and visual elements to your trading style:
– UseBarCount & BarCount (Default: 10000): Controls the historical bar buffer used for calculations.
– MA1TextColor & MA2TextColor: Customizes display colors for the respective MA price values (e.g., Orange for MA1, DeepSkyBlue for MA2).
– MADiffPositiveColor, MADiffNegativeColor, MADiff0Color: Sets specific text colors based on whether MA1 is above MA2 (Lime), below MA2 (Red), or equal (White).
– font_size (Default: 12): Adjusts text size on the chart screen.
– MA1_Period & MA2_Period: Sets lookback periods (e.g., Fast MA = 8, Slow MA = 50).
– MA_ma_method & MA_Applied_Price: Configures math methods (0=SMA, 1=EMA, etc.) and price sources (0=Close, etc.).
– myXoffset & myYoffset: Adjusts horizontal and vertical screen placement.
Trading Strategies with 2 MA Difference Indicator MT4
1. Quantifying Crossovers: When the difference value approaches zero ($0.00000$), a crossover is imminent. A shift from negative to positive confirms a bullish crossover, while positive to negative confirms a bearish crossover.
2. Measuring Trend Expansion and Contraction: Widening positive or negative differences indicate accelerating trend momentum, encouraging position holding. Narrowing differences alert traders to potential exhaustion or consolidation.
3. Identifying Mean Reversion Opportunities: Extreme historical spread values signal overextended price action, suggesting that prices are due for a pullback toward the slower moving average.
Pros and Cons of 2 MA Difference Indicator MT4
Pros:
– Replaces guesswork with precise numerical measurements of moving average distance.
– Keeps main charts clean by displaying statistics as a compact text block rather than requiring additional sub-windows.
– Highly customizable parameters for periods, methods, colors, and screen positions.
Cons:
– Moving averages are lagging indicators by nature, so spread metrics reflect past price action.
– Displays numerical data for current bars rather than plotting a historical line chart of the difference.
Conclusion
The 2 MA difference indicator MT4 is a practical, lightweight, and efficient utility for any trader who relies on moving average strategies. By converting visual gap estimation into concrete numerical data, it helps traders measure momentum, spot exhaustion early, and refine crossover entries with greater confidence
Download