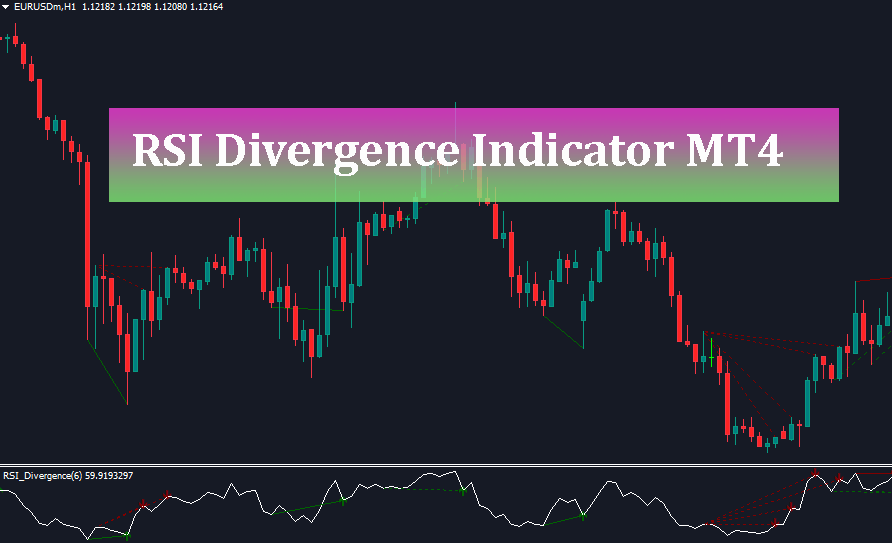
RSI Divergence Indicator MT4 automatically detects and plots bullish and bearish divergences between price action and the Relative Strength Index to help traders spot potential market reversals and trend continuation zones with high precision.
Introduction to the RSI Divergence Indicator
In the fast-paced world of Forex and financial trading, identifying trend exhaustion early can mean the difference between a profitable trade and a losing streak.
Traditional oscillators like the Relative Strength Index (RSI) are brilliant for measuring overbought and oversold conditions, but manually scanning multiple charts for divergences is time-consuming and prone to human error.
This is where the RSI Divergence Indicator MT4 steps in as an indispensable tool for technical traders.
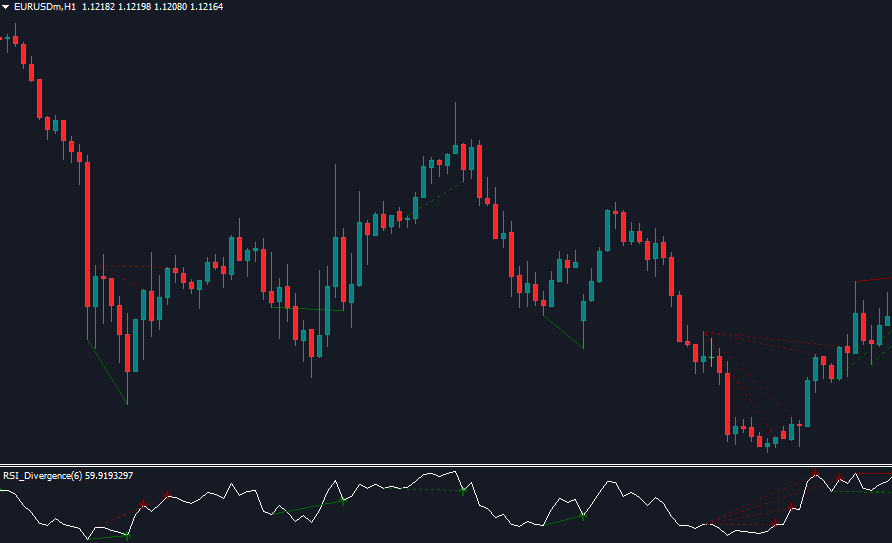
Designed specifically for the MetaTrader 4 platform, this custom indicator automates the process of finding discrepancies between the price chart and the RSI indicator window.
By drawing trendlines directly on both the main chart and the sub-window, it highlights hidden market opportunities that everyday traders often miss.
Whether you are a scalper trading the 1-minute chart or a swing trader analyzing daily timeframes, understanding how to integrate this tool into your arsenal will dramatically upgrade your technical analysis workflow.
Understanding RSI Divergence: The Core Concept
Before diving deep into the indicator itself, let us revisit what divergence actually means in technical analysis.
Divergence occurs when the movement of the price action contradicts the movement of a technical indicator (in this case, the RSI).
There are two primary types of divergences you need to know:
1.Regular Divergence (Reversal Signals):
– Bullish Regular Divergence: Price makes lower lows ($LL$), but the RSI makes higher lows ($HL$). This indicates weakening bearish momentum and hints at an upcoming upward reversal.
– Bearish Regular Divergence: Price makes higher highs ($HH$), but the RSI makes lower highs ($LH$). This signals fading bullish momentum and suggests a potential downward reversal.
2. Hidden Divergence (Trend Continuation Signals):
– Bullish Hidden Divergence: Price makes higher lows ($HL$), while the RSI makes lower lows ($LL$). This shows a continuation of the existing bullish trend during a healthy pullback.
– Bearish Hidden Divergence: Price makes lower highs ($LH$), while the RSI makes higher highs ($HH$). This points toward the continuation of a prevailing downtrend.
The RSI Divergence Indicator MT4 takes care of identifying all four of these patterns automatically, saving you hours of chart staring.
Key Features of the RSI Divergence Indicator MT4
Why do professional traders favor this specific MT4 tool over standard oscillators? Let us examine its standout features:
– Automated Visual Lines: The indicator automatically plots solid and dashed lines on both the price chart and the indicator window, showing exact swing points.
– Customizable RSI Period: By default, the RSI period is set to a responsive value (often 6 or 14), but you can easily tweak it in the input settings to match your trading strategy.
– Alerts and Notifications: Never miss a setup. The tool includes built-in alert systems (displayAlert and alertsON) that can notify you via pop-ups, emails, or push notifications when a new divergence forms.
– Hidden Divergence Toggle: You can choose whether to display regular divergences only or include hidden divergences using the displayHiddenDiv parameter.
– Clean Interface: It separates configuration clearly with dedicated text separators, making customization straightforward even for beginners.
Recommended Input Settings:
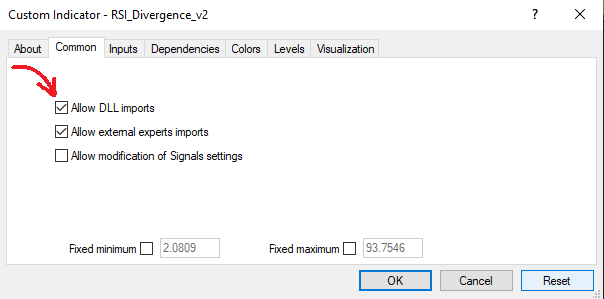
Important: Check the ‘Allow DLL imports’ box when installing the indicator.
– RSI Period: 6 (or 14 for smoother, less sensitive readings on higher timeframes).
– drawIndicatorTrendLines: true (draws lines on the RSI sub-window).
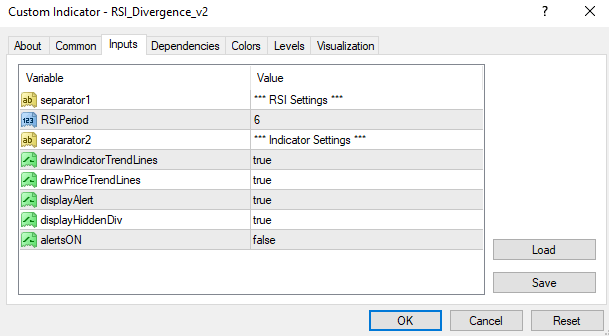
– drawPriceTrendLines: true (draws matching lines on the main price candles).
– displayAlert: true (enables prompt alerts on your screen).
– displayHiddenDiv: true (includes trend continuation signals).
– alertsON: false or true (depending on whether you want sound/push notifications).
Trading Strategies Using the RSI Divergence Indicator MT4
Strategy 1: Reversal Trading with Regular Divergence
– Step 1: Wait for the RSI Divergence Indicator MT4 to plot a Bearish Regular Divergence at a major resistance level or horizontal supply zone.
– Step 2: Look for confirmation candles, such as a bearish engulfing pattern or a pin bar rejecting the resistance.
– Step 3: Open a Sell position. Place your Stop Loss a few pips above the recent swing high.
– Step 4: Set your Take Profit at the nearest support level or use a favorable risk-to-reward ratio of at least 1:2.
Strategy 2: Trend Continuation with Hidden Divergence
– Step 1: Identify an established uptrend on the H1 or H4 timeframe.
– Step 2: Wait for a temporary pullback where the price forms a higher low, while the indicator displays a Bullish Hidden Divergence.
– Step 3: Enter a Buy order in the direction of the main trend as soon as the candle closes bullishly.
– Step 4: Place your Stop Loss below the recent swing low pullback point and target previous high levels for profit extraction.
Advantages and Limitations
Pros:
Saves Time: Eliminates the tedious chore of manual chart scanning across multiple pairs.
Objective Signals: Removes emotional bias by following strict mathematical high/low pivot calculations.
Versatility: Works across all asset classes available on MT4, including Forex currencies, cryptocurrencies, indices, and commodities.
Multi-timeframe Friendly: Operates smoothly from M1 scalping charts up to Monthly macro charts.
Cons:
– Repainting Risk: On lower timeframes, developing divergences can sometimes shift or disappear if a candle closes differently. Always wait for the candle to close before executing trades.
– False Signals in Strong Trends: In a powerful trending market, regular divergences can appear multiple times before an actual reversal happens. Always combine this indicator with trend filters.
Conclusion
Mastered divergence trading is a rite of passage for many successful technical traders.
The RSI Divergence Indicator MT4 simplifies this advanced trading technique by automating pattern recognition and presenting clear visual cues right on your MetaTrader 4 screen.
Download
Frequently Asked Questions (FAQ)
1. Does the RSI Divergence Indicator MT4 repaint?
In most stable versions, once a candle is fully closed, the divergence line locks into place. However, while a candle is currently forming, pending pivot lines may adjust as price fluctuates.
2. Can I use this indicator for scalping?
Yes, many scalpers apply the RSI Divergence Indicator MT4 on 1-minute (M1) and 5-minute (M5) charts, though it is recommended to filter trades using higher timeframe trends to avoid market noise.
3. What is the best RSI period setting?
A period of 14 is the classic standard, but a setting of 6 is often used by active traders to capture more frequent short-term divergence setups.
One Reply to “RSI Divergence Indicator MT4”