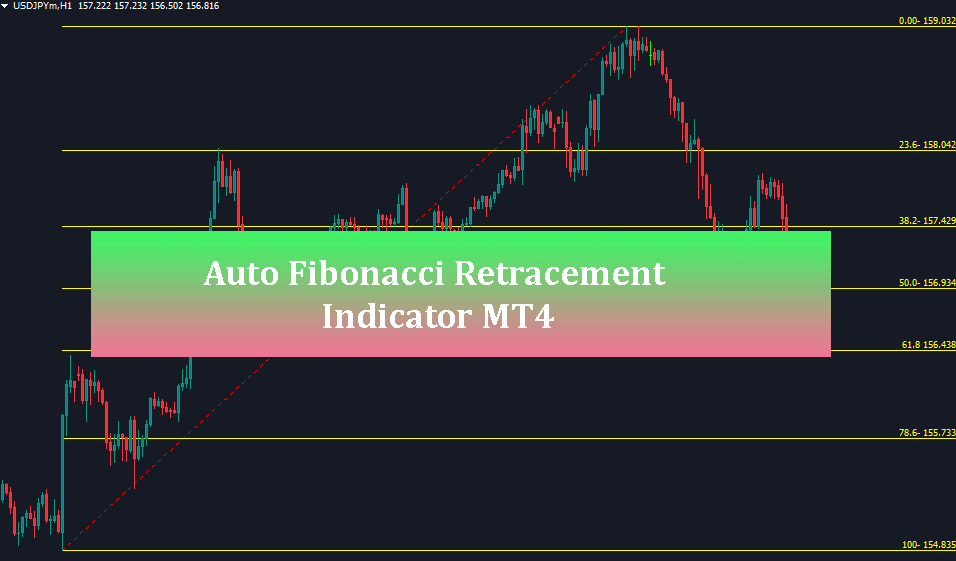
Auto Fibonacci Retracement Indicator MT4 is an essential technical analysis tool designed to automatically identify and plot key Fibonacci retracement levels on MetaTrader 4 charts, saving traders valuable time and eliminating subjective manual drawing errors.
Fibonacci retracement levels are among the most trusted technical tools used by forex, stock, and cryptocurrency traders worldwide. They help pinpoint potential reversal zones, dynamic support/resistance levels, and precise profit targets. However, manually identifying key price swings—swing highs and swing lows—can be subjective and inconsistent, especially for beginner traders. The Auto Fibonacci Retracement Indicator MT4 automates this entire workflow by constantly updating Fibonacci ratios as new price action unfolds.
What is the Auto Fibonacci Retracement Indicator MT4?
The Auto Fibonacci Retracement Indicator MT4 is a custom MetaTrader 4 indicator that continuously scans market price action to detect major swing points. Once a significant price move is identified, it instantly calculates and draws standard Fibonacci retracement levels (such as 23.6%, 38.2%, 50.0%, 61.8%, and 78.6%) directly onto the price chart.
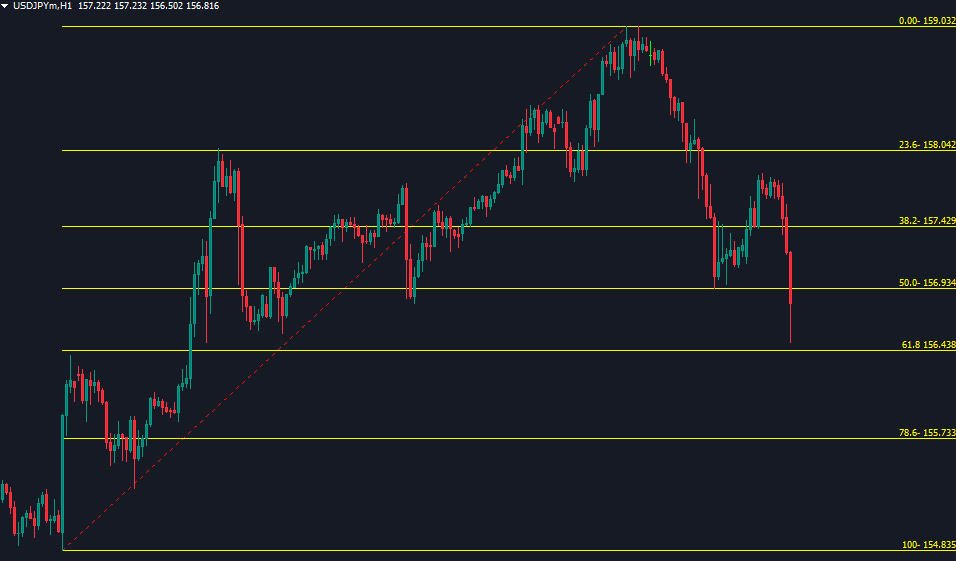
By replacing manual drawing with real-time algorithmic calculations, this indicator provides objective, consistent key levels across all currency pairs and timeframes.
Key Visual Features:
• Automatic Swing Point Detection: Uses price action peaks and troughs to establish accurate anchor points (0.0% to 100.0%).
• Clear Price & Ratio Labels: Displays exact Fibonacci percentages alongside corresponding price values (e.g., 61.8 - 156.438, 38.2 - 157.429) directly on the right side of the chart canvas.
• Trend & Structure Line: Draws a diagonal connecting line between the swing low and swing high to visually confirm the active impulse wave.
Key Features & Benefits
1. Eliminates Subjectivity and Manual Bias: Deciding which high or low to pick when drawing manual Fibonacci lines often creates trader confusion. The Auto Fibonacci Retracement Indicator MT4 uses a consistent mathematical logic to define market structure, ensuring your chart analysis remains objective and reproducible.
2. Dynamic Real-Time Updates: As market volatility expands or a new higher high/lower low is formed, the indicator dynamically adjusts the Fibonacci grid to reflect current market conditions without requiring manual chart maintenance.
3. Multi-Timeframe Adaptability: Whether you are scalping on the 5-minute (M5) chart, day trading on the 1-hour (H1) chart, or position trading on the daily (D1) chart, the indicator seamlessly adapts to any timeframe and asset class, including Forex majors, Gold (XAUUSD), Indices, and Crypto.
How to Trade Using the Auto Fibonacci Retracement Indicator MT4
Trading with Fibonacci retracements revolves around identifying pullbacks within a dominant trend and entering in the direction of that trend at key discount/premium prices.
1. Buy Strategy (Uptrend Pullback)
In a bullish market, the indicator draws a Fibonacci grid stretching from a lower swing point (100.0%) up to a higher swing point (0.0%).
• Wait for a Retracement: Allow price to pull back from its high toward the 50.0% or 61.8% (Golden Ratio) retracement levels.
• Look for Confluence: Wait for price action confirmation, such as a bullish pin bar, engulfing candle, or oversold RSI confirmation around these key support lines.
• Entry: Open a BUY position when price bounces cleanly off the 50.0% or 61.8% support level.
• Stop-Loss: Place your Stop-Loss slightly below the 78.6% level or recent swing low (100.0%).
• Take-Profit: Target the 23.6% level or the swing high (0.0% level) for an optimal risk-to-reward ratio.
2. Sell Strategy (Downtrend Retracement)
In a bearish market, the indicator anchors from an upper swing high down to a lower swing low.
• Wait for a Retracement: Allow price to rally upward into the 38.2%, 50.0%, or 61.8% resistance zones.
• Look for Confluence: Check for bearish price action signals (e.g., shooting star candle, bearish engulfing, or resistance at a moving average).
• Entry: Open a SELL position as price rejects the Fibonacci resistance zone.
• Stop-Loss: Place your Stop-Loss a few pips above the 78.6% level or swing high.
• Take-Profit: Set target levels at the 0.0% low or extended projection levels.
Input Settings & Customization Guide
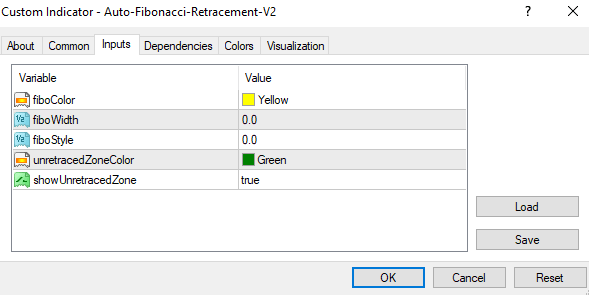
The Auto Fibonacci Retracement Indicator MT4 offers simple, straightforward parameter settings in the MetaTrader 4 input tab:
• fiboColor (Default: Yellow): Sets the color of the horizontal Fibonacci level lines and price labels displayed on your chart.
• fiboWidth (Default: 0.0): Controls the line thickness of the Fibonacci levels. Increase the value for thicker, bolder lines.
• fiboStyle (Default: 0.0): Sets the line style (solid, dashed, or dotted) for the Fibonacci level grid.
• unretracedZoneColor (Default: Green): Defines the display color for highlighting unretraced market structure zones.
• showUnretracedZone (Default: true): Toggles the visual background rendering of unretraced price zones on or off.
Confluence Strategies for Higher Win Rates
While the Auto Fibonacci Retracement Indicator provides high-probability support and resistance levels, combining it with complementary technical tools will significantly increase trade reliability:
1. Horizontal Support & Resistance: Pay close attention when a Fibonacci level (like 61.8%) overlaps directly with a major horizontal support or resistance level established on a higher timeframe.
2. Moving Averages: Look for pullbacks where the 50.0% or 61.8% Fibonacci line coincides with a key moving average (e.g., 50 EMA or 200 EMA).
3. Price Action Candlestick Patterns: Never enter blindly at a Fibonacci line. Always wait for price action rejection signals (dojis, hammer candles, or engulfing patterns) to confirm that buyers or sellers are defending the level.
Conclusion
The Auto Fibonacci Retracement Indicator MT4 is a must-have tool for any technical trader looking to streamline their chart analysis and trade high-probability pullback setups. By automatically identifying key swing points and plotting precise Fibonacci retracement levels in real time, it eliminates guesswork, saves time, and boosts trading consistency. Integrate it into your broader price action trading strategy with strict risk management for optimal results!