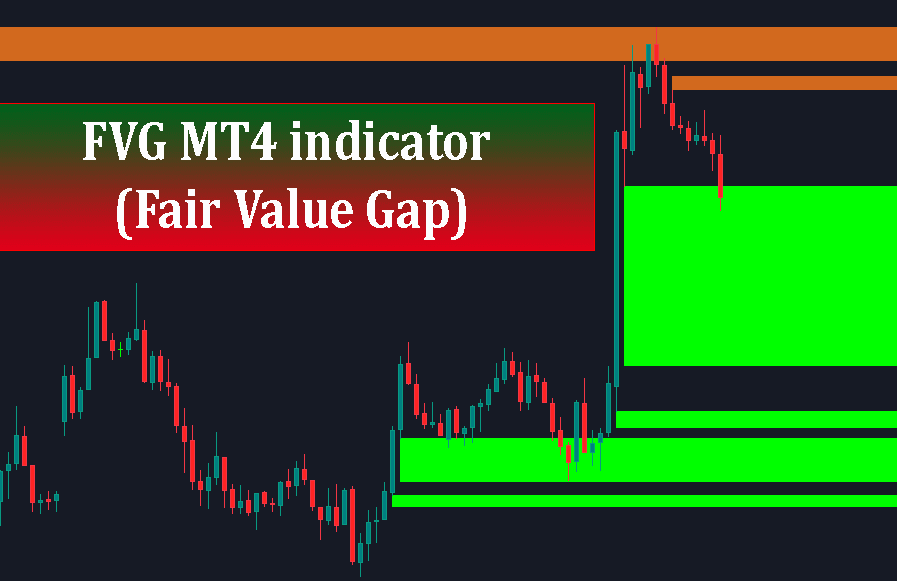
The FVG MT4 indicator is an essential tool for traders implementing Smart Money Concepts, ICT strategies, or advanced price action analysis. By automatically locating institutional imbalances, highlighting bullish and bearish gap zones, and sending real-time alerts, this indicator streamlines technical analysis and improves execution speed.
In modern institutional trading, identifying market inefficiencies is one of the most effective ways to spot high-probability trade setups. Among the core principles of Smart Money Concepts (SMC) and Inner Circle Trader (ICT) methodology, the Fair Value Gap (FVG) stands out as a critical element.
While identifying FVGs manually across multiple timeframes can be time-consuming and prone to human error, using a specialized FVG MT4 indicator automates the entire process. In this comprehensive guide, we will explore what a Fair Value Gap is, how the FVG MT4 indicator works, key visual setups, best trading strategies to elevate your trading performance.
What is a Fair Value Gap (FVG)?
A Fair Value Gap (FVG) represents a market imbalance or inefficiency caused by intense buying or selling pressure. When financial institutions, hedge funds, or central banks enter large positions in the Forex, gold, or equity markets, price moves so aggressively in one direction that one side of the market is left behind without sufficient liquidity.
The 3-Candlestick Pattern Anatomy
A valid Fair Value Gap is formed by a sequence of three consecutive candlesticks:
-
Bullish FVG (Buying Imbalance):
-
Candle 1: The starting candle establishing the initial price point.
-
Candle 2: A large, aggressive bullish impulse candle.
-
Candle 3: The following candle after the impulse move.
-
The Gap: A Bullish FVG occurs when the high of Candle 1 does not overlap with the low of Candle 3. The empty space between Candle 1’s high and Candle 3’s low represents the unmitigated Fair Value Gap.
-
-
Bearish FVG (Selling Imbalance):
-
Candle 1: The starting candle.
-
Candle 2: A large, aggressive bearish impulse candle.
-
Candle 3: The subsequent candle.
-
The Gap: A Bearish FVG occurs when the low of Candle 1 does not overlap with the high of Candle 3.
-
Because the market strives for equilibrium, price frequently retraces back into these gap zones to “fill” or “mitigate” the inefficiency before continuing its original trajectory.
Overview of the FVG MT4 Indicator
The FVG MT4 indicator is an automated technical tool designed specifically for MetaTrader 4. It scans price charts in real-time across any asset class (Forex pairs, XAUUSD, Indices, Crypto) and automatically draws dynamic zones directly on your chart where price imbalances occur.
Key Visual Features on MT4
As seen in standard SMC trading templates:
-
Bullish FVG Zones: Highlighted in vivid green rectangular boxes below current price action, serving as potential demand or buy-entry zones during retracements.
-
Bearish FVG Zones: Highlighted in orange or red rectangular boxes above current price action, serving as potential supply or sell-entry zones.
How to Trade with the FVG MT4 Indicator
Here are three powerful trading strategies you can use:
Strategy 1: FVG Retrace & Continuation (The Bread and Butter)
-
Identify the Trend: Look for a clear bullish or bearish market structure break (MSB / BOS).
-
Spot the FVG Zone: Allow the FVG MT4 indicator to highlight a fresh, unmitigated FVG created during the impulse wave.
-
Wait for the Retracement: Wait patiently for price to pull back into the shaded FVG zone (the green or orange box).
-
Entry & Risk Management:
-
Enter a trade when price touches the 50% equilibrium level (Consequent Encroachment) of the FVG box.
-
Place your Stop Loss (SL) slightly beyond the outer wick of Candle 1.
-
Set your Take Profit (TP) at the next liquidity pool (recent swing high or low).
-
Strategy 2: Confluence with an Order Block MT4 Indicator
Order blocks represent where institutional market participants place massive buy or sell orders. When an Order Block directly aligns with a Fair Value Gap, it forms a high-probability confluence zone:
-
Identify an active Order block MT4 indicator level.
-
Check if a fresh FVG sits right adjacent to or inside the Order Block.
-
This dual confluence acts as a strong magnetic level, offering tight Stop Loss setups and elevated Risk-to-Reward (RR) ratios.
Strategy 3: Multi-Timeframe Top-Down Alignment
-
Step 1 (HTF Bias): Open an H4 or Daily chart using the Smart Money Concepts indicator MT4 framework to identify the overall direction and major HTF FVGs.
-
Step 2 (LTF Entry): Drop down to the M5 or M15 timeframe. Wait for price to touch the HTF FVG, then look for a local market structure shift followed by a lower-timeframe FVG generated by the ICT MT4 indicator setup.
-
Step 3: Enter on the LTF FVG retracement for maximum precision and minimal drawdowns.
Real Chart Example Analysis: EUR/USD H1 Chart
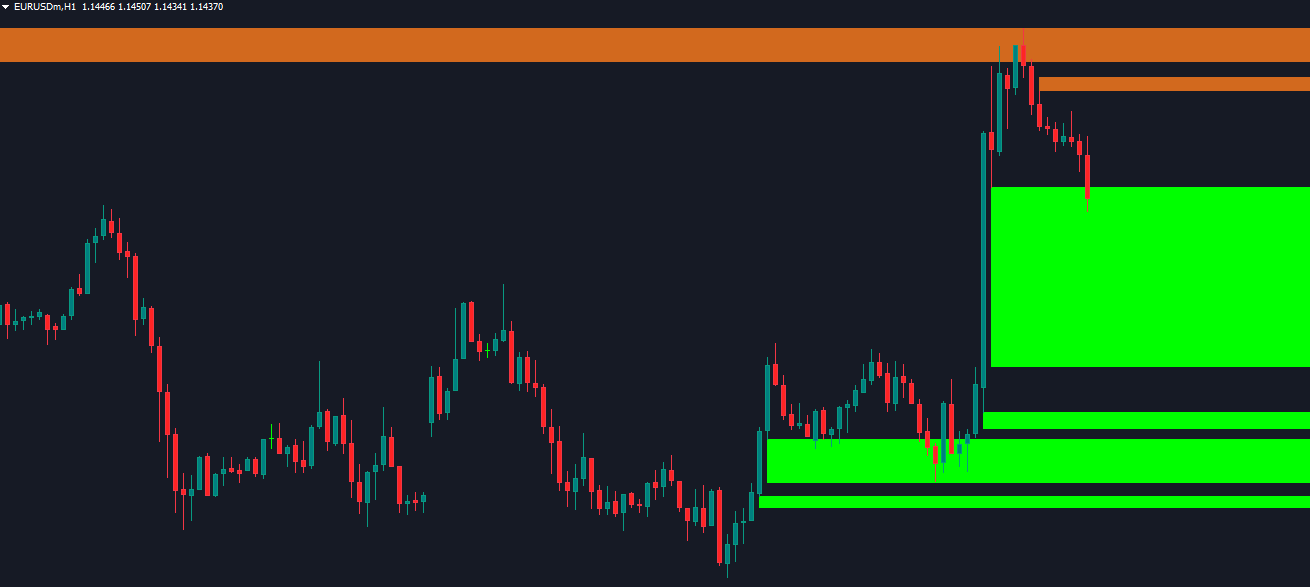
To better understand how the FVG MT4 indicator identifies market inefficiencies and provides actionable trading setups, let us analyze the provided EUR/USD H1 chart example:
Key Observations from the Chart Analysis:
1. Massive Bullish Impulse Move:
On the right side of the chart, notice the strong bullish expansion formed by consecutive large green candles. This sudden surge in price action reflects heavy institutional buying pressure, leaving behind significant price imbalances.
2. Large Bullish FVG Zone (Bright Green Box):
The FVG MT4 indicator automatically detects this huge gap between the wick highs of the initiating candles and the low of the subsequent candles. It highlights this inefficiency as a prominent bright green rectangular zone.
–> Trading Application: As price pulls back down from its local high, this green FVG box serves as a primary Demand / Buy-Entry Zone. Smart money traders wait for price to retrace into this area to fill liquidity before looking for long opportunities.
3. Multiple Confluence Support Zones (Lower Green Bars):
Beneath the primary large FVG, the indicator draws multiple stacked, narrower green boxes. These represent lower-timeframe or previous bullish Fair Value Gaps that remain partially unmitigated.
–> Trading Application: These zones act as strong secondary support levels (confluence zones) in case price experiences a deeper retracement.
4. Bearish FVG & Premium Resistance Zones (Orange Boxes at Top):
At the top of the price move, after price reached the major high, a strong downward rejection created a Bearish FVG (highlighted in orange).
–> Trading Application: These orange boxes mark overhead supply zones. They indicate where institutional sellers entered the market, providing potential target areas (Take Profit) for long trades or potential reversal zones for short setups.
Practical Trade Strategy Based on This Chart:
-
Bias: Overall Bullish due to the strong upward impulse.
-
Entry Plan: Wait for price to drop into the top boundary or 50% midpoint of the massive green Bullish FVG box.
-
Confirmation: Look for lower-timeframe reversal price action (such as a M5 or M15 market structure shift).
-
Target: Target the top swing highs into the upper orange Bearish FVG zone.
Download
FVG MT4 indicator (Fair Value Gap) [Free download]